


The Ethereum price is falling below the levels it reached in August, creating fear that the price may decline even further. With ETF outflows and BlackRock converting substantial volumes of ETF to exchanges, putting pressure, traders are closely watching a potential escalation of the correction.
BlackRock Selling and Rising ETF Outflows
Ethereum price has been struggling in September, falling to the value of around 4,330, approximately 13 per cent, below its end-August price. One of the issues that influenced this weakness is the selling pressure by BlackRock, the largest asset manager in the world. According to on-chain data, the company has sold 312.5 million dollars of ETH to Coinbase this week. Such movements usually signal intent to sell.
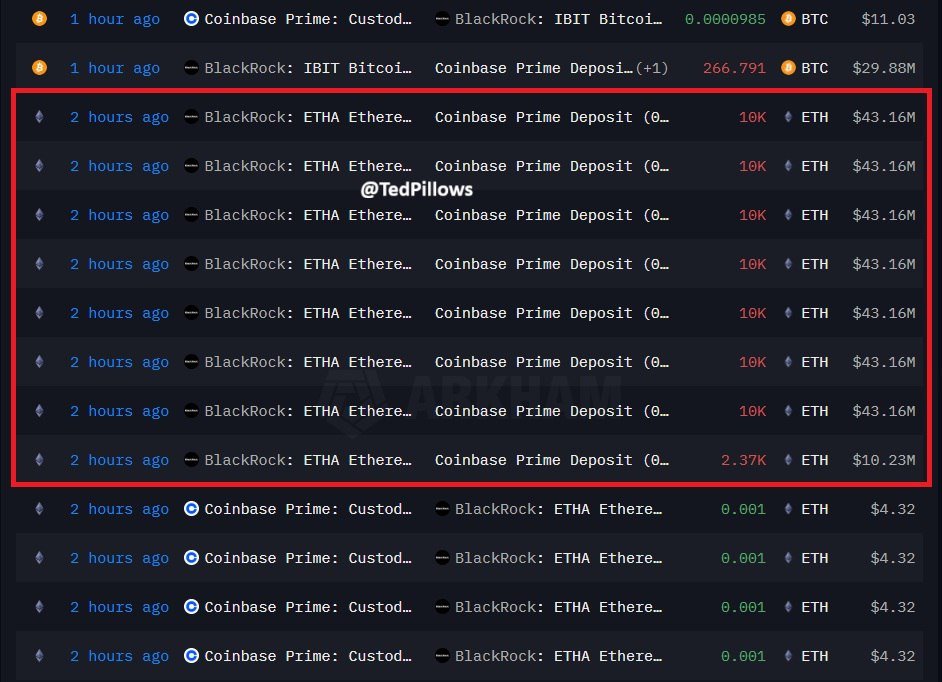
This activity lines up with a wave of Ethereum ETF outflows. Data from SoSoValue revealed $446 million in net outflows on Friday alone. Over the past five days, these funds have seen consistent withdrawals, pushing cumulative inflows down to $12.7 billion. The iShares Ethereum Trust, in particular, lost $309 million in assets on Friday. The timing suggests BlackRock’s selling may be linked to broader redemptions in ETH-focused products.
Ethereum ETF outflows, however, are not new to the markets. Earlier in August, ETH funds shed $237 million in a single week, only to rebound with $1.08 billion of inflows the following week. This history leaves open the possibility of a reversal if sentiment shifts back in Ethereum’s favor.
Nevertheless, there are a number of favorable Ethereum drivers. The enterprises supported by the treasury keep gaining huge collections of ETH. Tom Lee, who is the leader of BitMine Immersion, owns more than 9 billion worth of coins, and SharpLink possesses approximately 800,000 ETH, and its value is 3.4 billion. On-chain data also is not weak, as the total assets of stablecoins on Ethereum exceed the threshold of $154-155 billion, significantly higher than other competitors.
Technical Signals Point to More Downside
It is also indicated by charts that Ethereum may experience further short-term weaknesses. ETH has dipped below the bottom of its rising channel since it reached its highest point of 4,955 on August 24. It is a sign of increasing bearishness.
The coin is currently below its 25-day Exponential Moving Average, and the Relative Strength Index has fallen sharply since the overbought 87 in July to a neutral 51. In history, downward movements in RSI values have usually been followed by additional falls until oversold levels.
In the meantime, MACD has become negative, and the bearish crossover indicates accumulating negative pressure. According to Murrey Math Lines, the following important support is at the level of $3,750. A shift to that degree appears more and more probable unless buyers intervene.
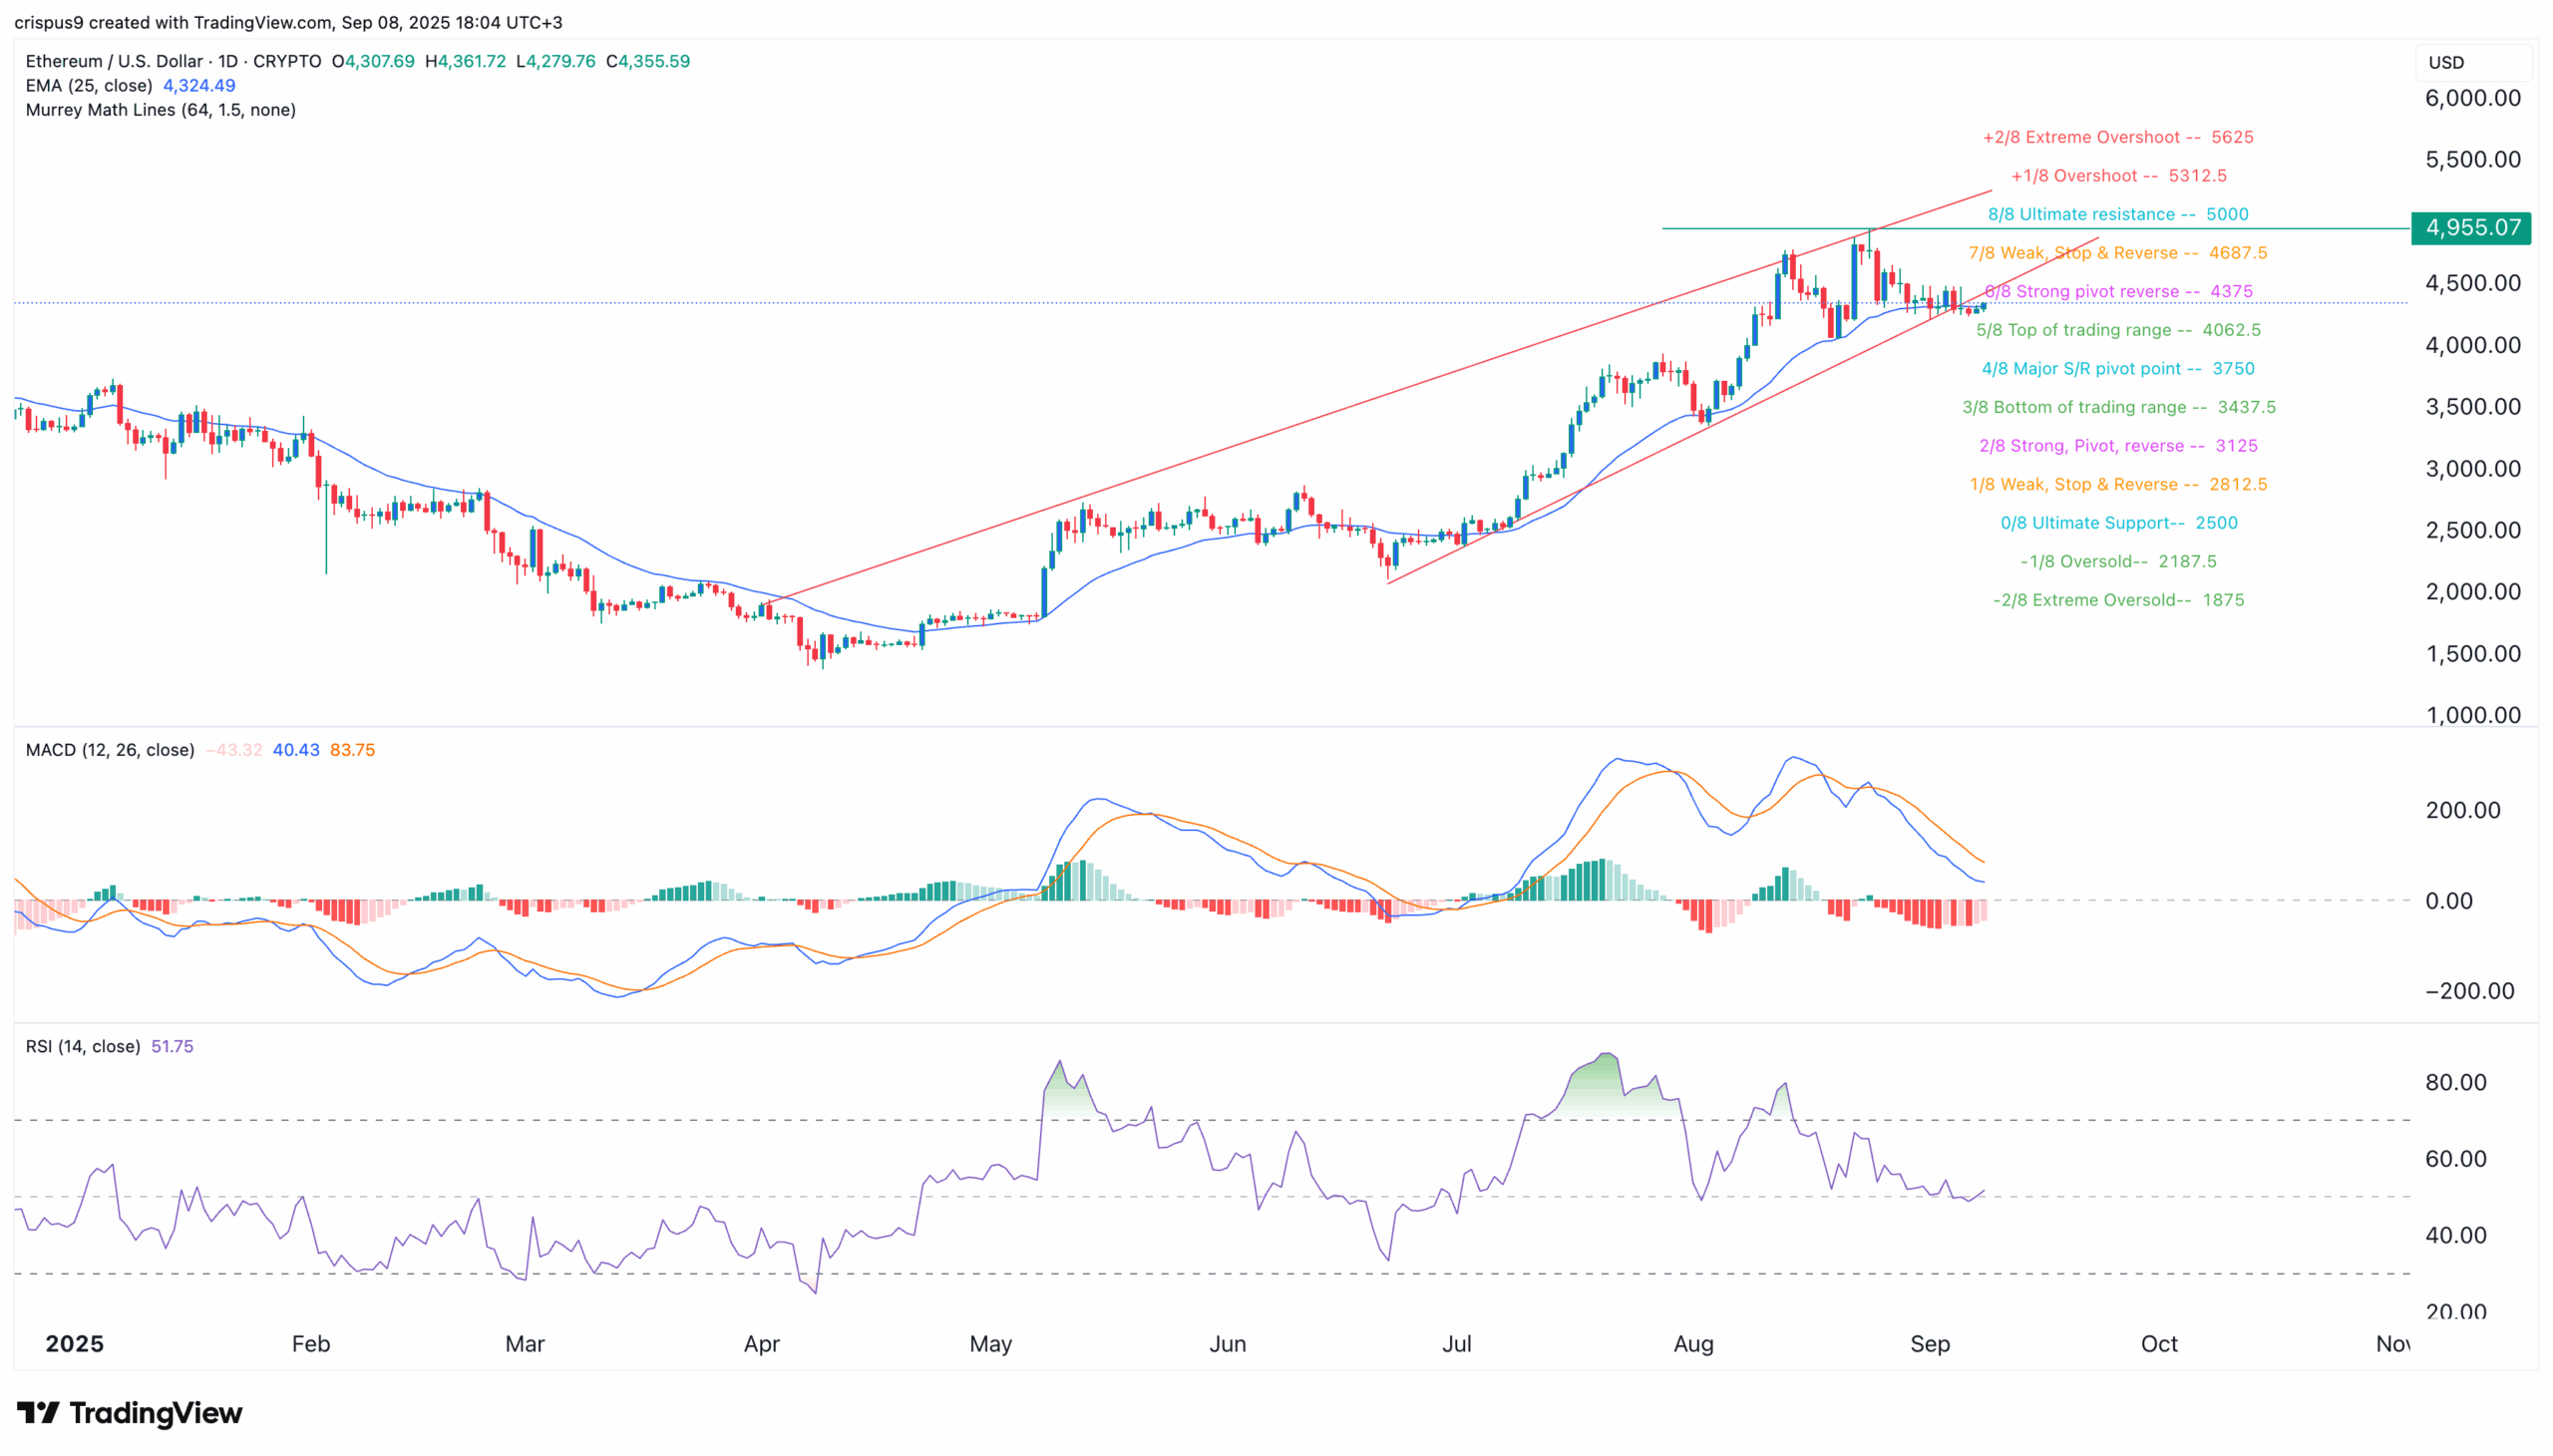
In the bullish scenario, Ethereum would have to revisit its August high of about $4,955. Breaching the above level would nullify the bearish formation and would mean a new impetus. Until, ETH traders might experience further turbulence as the selling and ETF outflows of BlackRock put a strain on sentiment.