


Ethereum price dropped to a weekly low of $2,400 amid a broader crypto market decline. The asset has fallen over 16% from this month’s high, placing it in technical correction territory. Despite this, Ethereum remains above a key support level, while technical indicators point to a possible bullish continuation.
Ethereum ETF Inflows Slow Amid Market Volatility
Spot Ethereum exchange-traded funds (ETFs) recorded $40 million in inflows this week. This marked a steep decline from the $528 million added during the prior week. It was the lowest weekly inflow since mid-May, according to SoSoValue.
Two key factors contributed to the slowdown. The broader decline in crypto prices has kept many investors cautious. Ethereum, Bitcoin, and other assets have struggled to maintain recent gains. Also, the U.S. markets had just four trading days due to the Juneteenth federal holiday.
Despite the slowdown, Ethereum ETFs have posted positive inflows for six straight weeks. Since their approval in September 2023, cumulative inflows now stand at $3.89 billion. The total assets held across these ETFs have reached $9.6 billion.
Ethereum Ecosystem Activity Declines in June
On-chain activity on Ethereum has slowed. Data shows that stablecoin transaction volume on the network has dropped by 31% in the last 30 days. The total volume now stands at $1.2 trillion.
This decline could be linked to falling user activity and reduced market participation during the recent price correction. Even so, Ethereum’s staking activity remains strong, with more than 35 million ETH now staked. This contributes to reduced liquid supply and may support long-term price stability.
Ethereum Technical Outlook Shows Bullish Flag Pattern
Ethereum’s price has traded in a tight range since May 10. The coin is moving between support at $2,410 and resistance at $2,736. This price formation is also termed as a bullish flag by analysts.
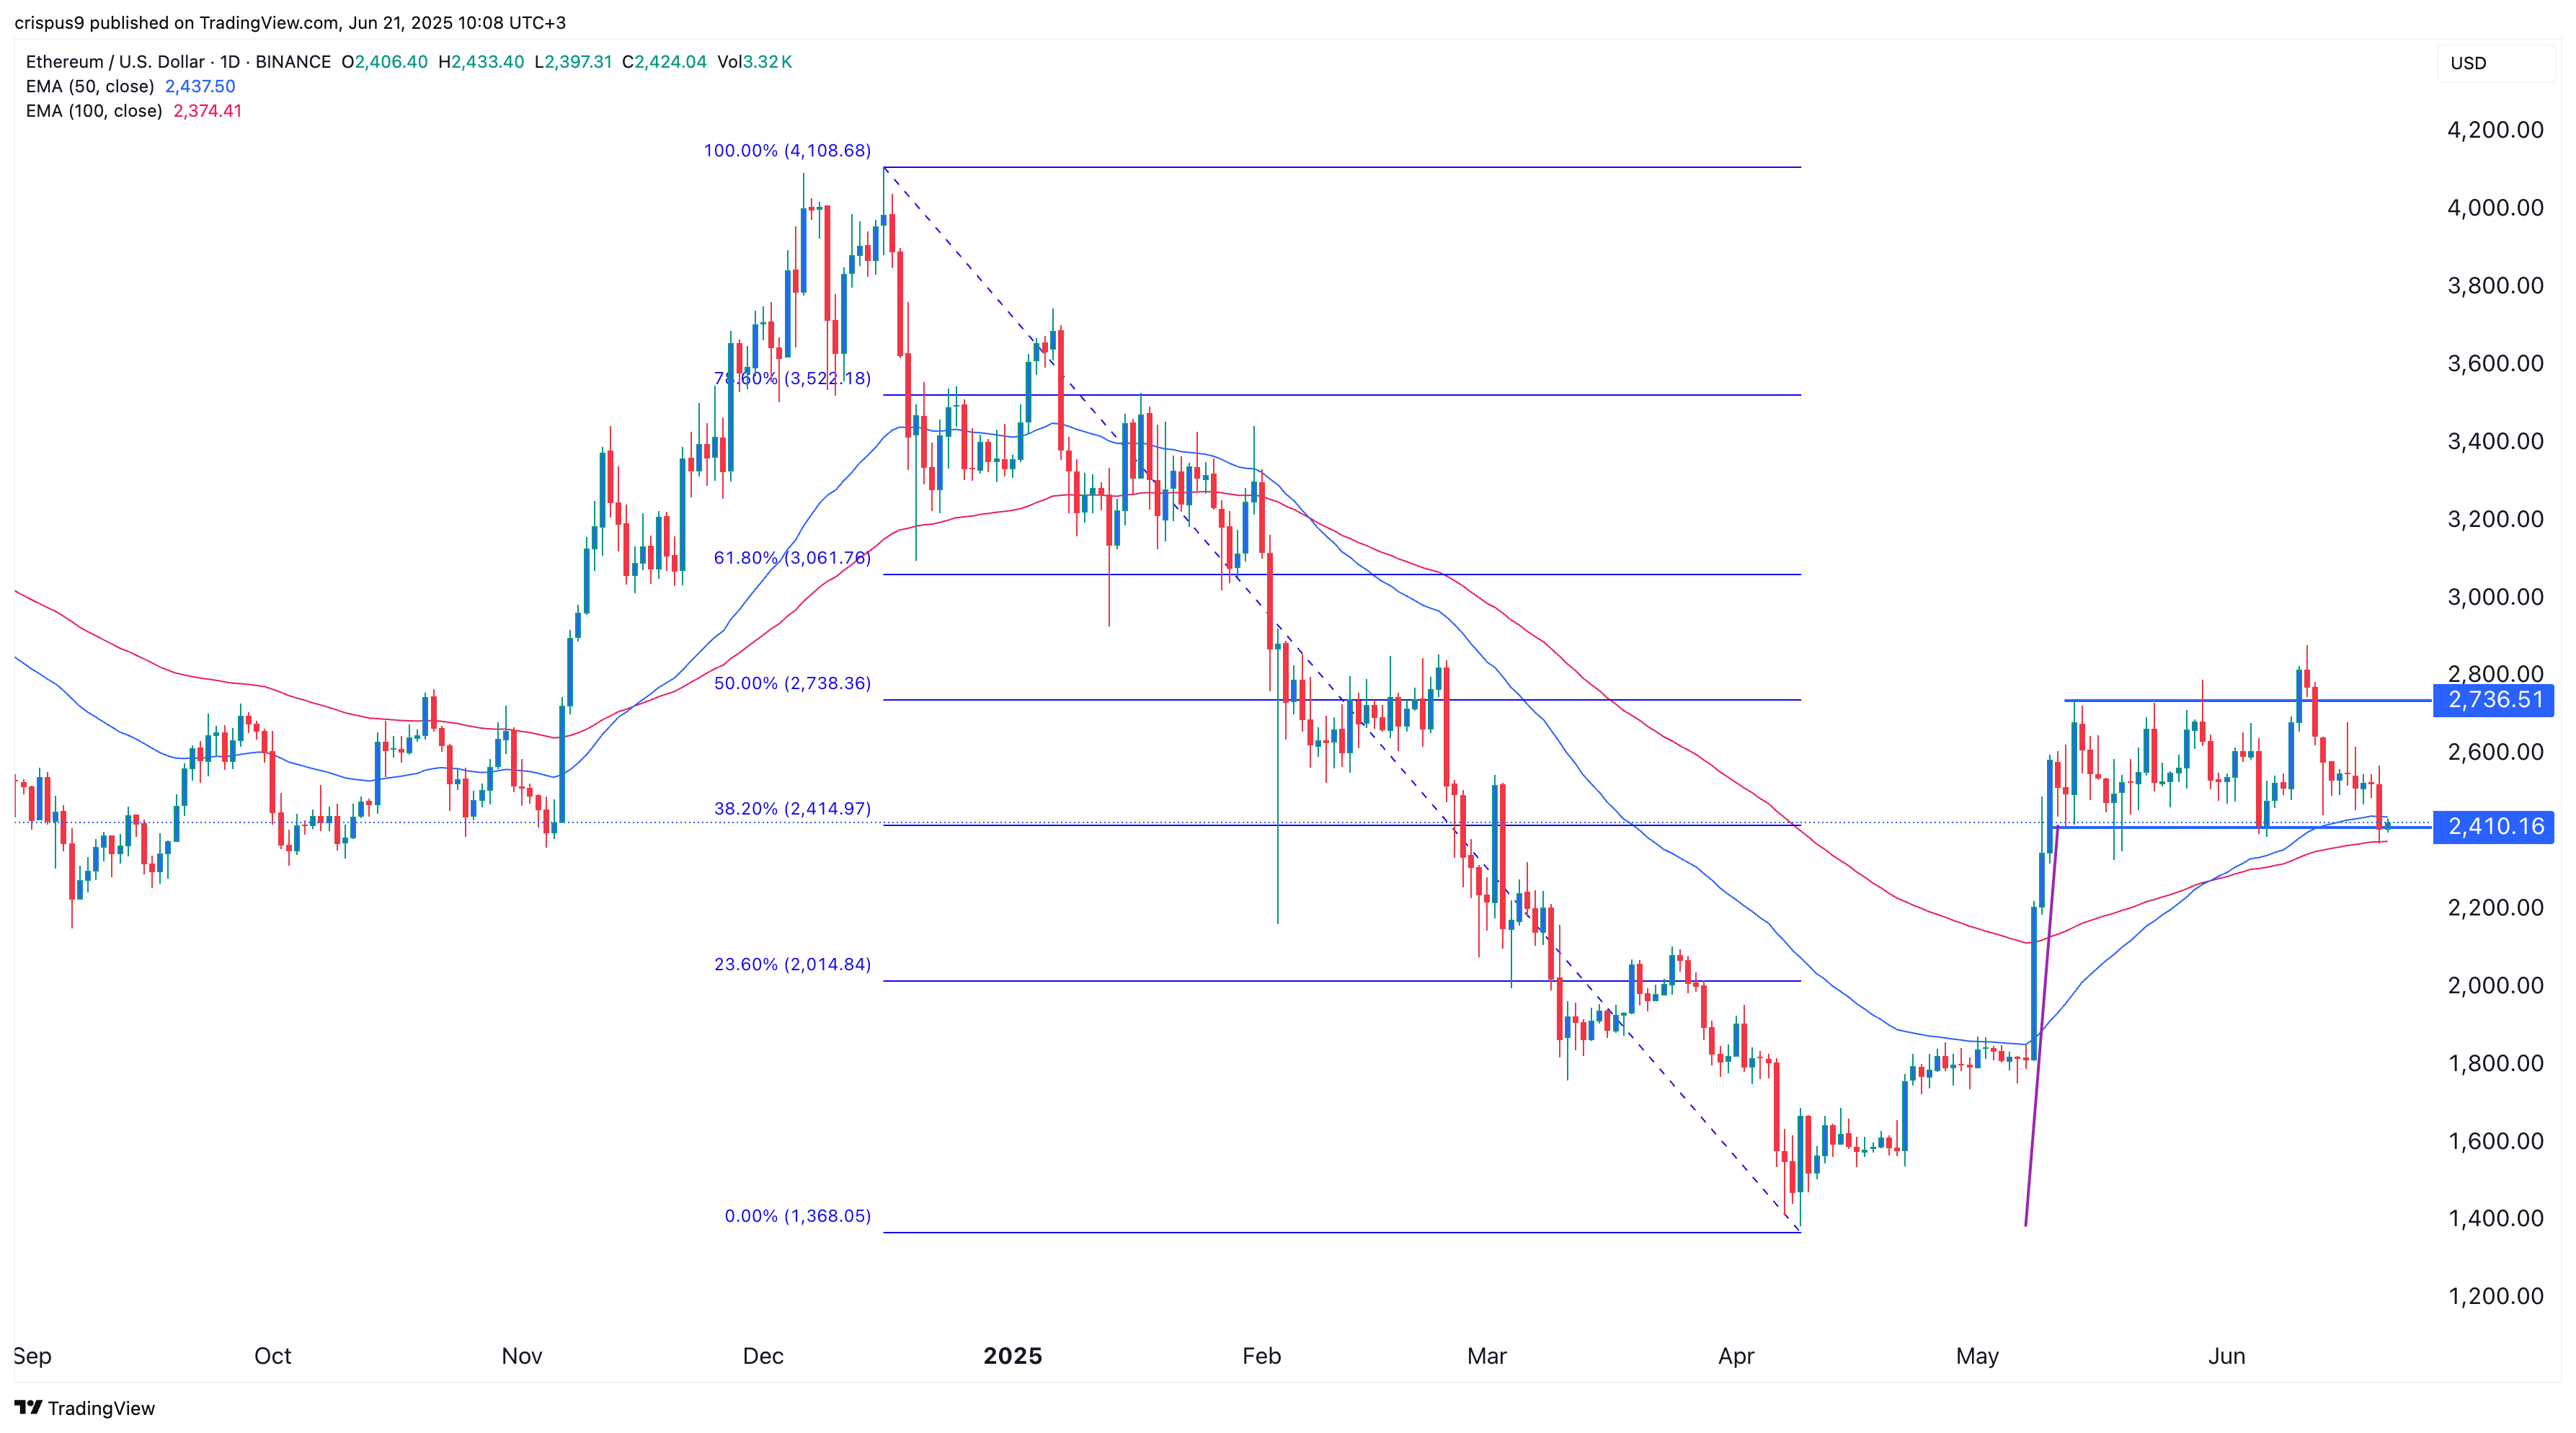
A bullish flag is the bull-type pattern production of a powerful up-move after which there is a temporary reorganization. This flag is building up between the 38.2 % and 50 % Fibonacci retracement zones. Ethereum is as well trading higher compared to the 50 days and 100 days exponential moving averages.
If the coin holds support at $2,400, a breakout to the upside could occur. Confirmation of further gains will come if the price moves above $2,735. In that case, the next resistance to watch would be the $3,000 psychological level.
Institutional Interest Remains with BlackRock and Fidelity ETFs
BlackRock’s ETHA remains the largest Ethereum ETF with $5.28 billion in inflows. Fidelity’s FETH has accumulated $1.1 billion. Together, these two account for the majority of capital allocated to ETH-focused exchange-traded funds.
Although this week saw a reduced rate of inflows, the current level of investor interest over the last month indicates that institutional exposure to Ethereum is becoming more prominent. This trend might be extended in the next few weeks in case the wider market recovers.
Ethereum’s actions, ETF flows, and on-chain measures will continue to be important to monitor. Theoretically, traders are seeking the validation of the bullish trend because Ethereum remains close to essential technical levels.
[…] with the U.S now entering the war, altcoins have crashed harder. As per CoinMarketCap data, Ethereum is currently trading at $2,265, dropping to this level for the first time in a month. Additionally, […]